Scoreboard
ShopPAK Add-on
Scoreboard is a powerful tracking tool that gives you myriad options for viewing and analyzing data.
ShopPAK manages a ton of data that cuts across your entire organization. Scoreboard reads this data and lets you customize exactly how you want it displayed. In a word, it is nimble. The perfect companion to ShopPAK, it keeps you apprised of status, performance, bottlenecks, issues, and key metrics. Whereas ShopPAK presents information in a hierarchical manner by job, job item, and work order, Scoreboard filters and combines information any way you like. For example, you might want to see work orders that span several jobs instead of just the work orders that belong to one job. Or you might want to see milestones that span a subset of jobs, instead of just the milestones belonging to one job.
Scoreboard is extremely flexible. Tell it what tab to show or hide, what data to display, and how the data should be grouped, sorted and presented. One of the most powerful features of Scoreboard is the ability to group data any way you wish. Do you want to see milestones grouped by project manager and then sub grouped by job? No problem. You are not limited to a handful of pre-defined choices. You gather any data you want via Scoreboard’s easy to use query and presentation tools.
Unattended Mode
Scoreboard runs in unattended mode, not unlike flight monitors that automatically update and show current flight status at airports. The idea is you place a large monitor in a particular department and configure Scoreboard to show only data relevant to that department. Since each seat of Scoreboard can be uniquely configured, you can set up as many unattended Scoreboards as you wish throughout the front office and shop.
Interactive Mode
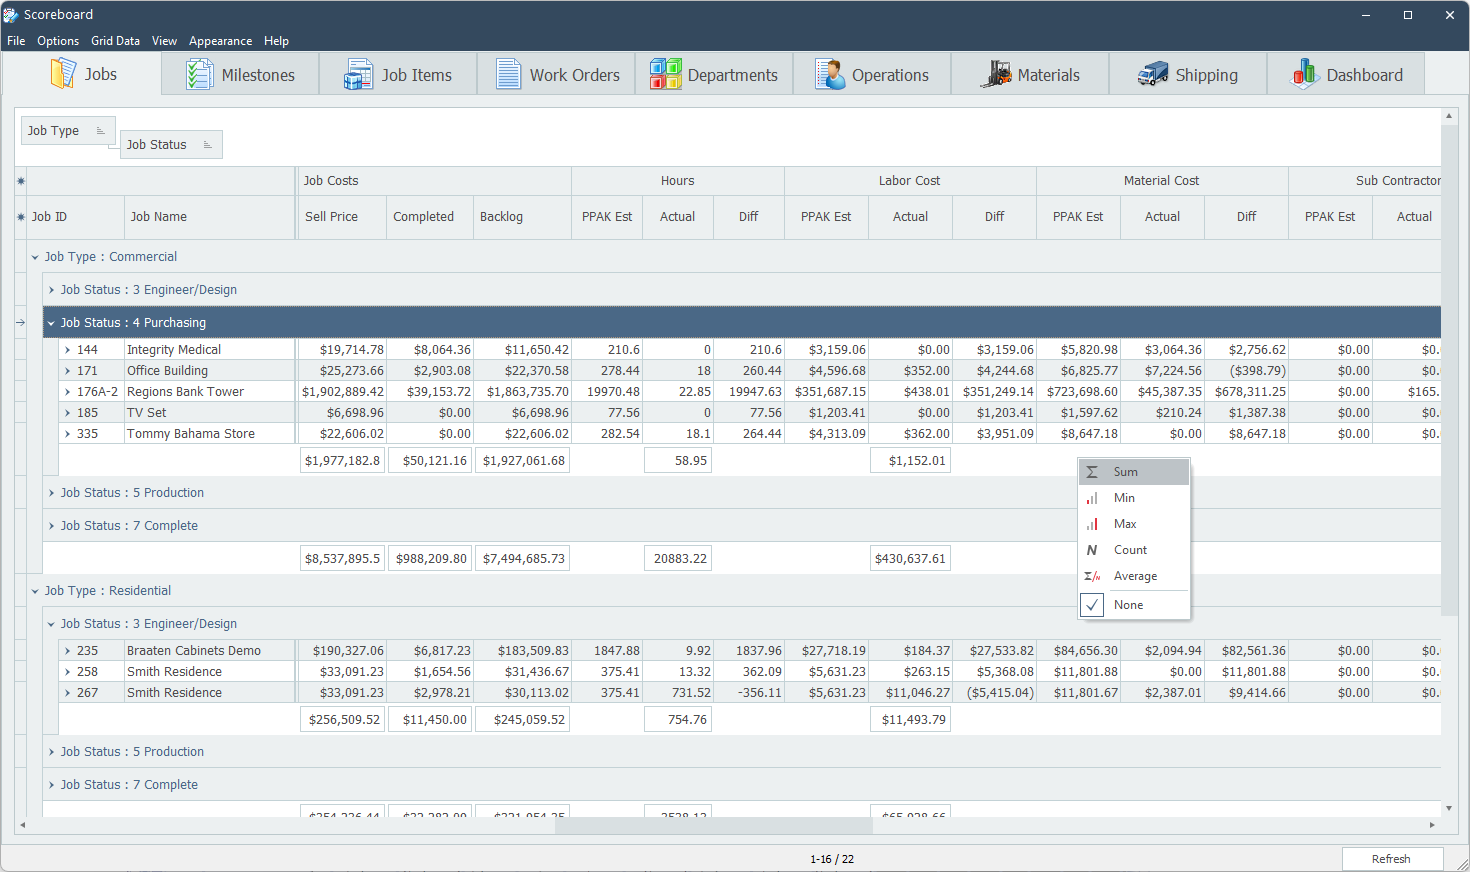
Scoreboard runs in interactive mode as well. In this mode, you install Scoreboard on a PC, laptop, or Windows tablet, and browse and edit ShopPAK data. The big difference between Scoreboard and ShopPAK is ShopPAK tends to organize and present information hierarchically. For example, you open a job, and then drill down into a work order. Scoreboard, on the other hand, uses grids to present information that cut across as many jobs, work orders, departments, and ship tickets as you wish to work with. Scoreboard is a dynamic and interactive reporting tool that is easily configured to display what you need.
Dashboards
Scoreboard includes several interactive dashboards that are great for “seeing the big picture” and spotting trends. We’ve optimized Scoreboard so it can read huge amounts of data and synthesize that data into various roll up graphical charts….instantaneously. You’ll be amazed how fast it reads, crunches data, and displays results.